Scientific Visualization
Scientific Visualization
Visualization of large numerical data through a set of most obvious images and animations is an essential requirement of CAE software. We have long experience in implementing algorithms of surface, volume and particle rendering of output fields. We are also proficient with VTK / Paraview based libraries and can integrate them into customized software. The ability to prepare scripts for offline rendered images allows us to add automation to CAE post-processing.
Our Expertise
- ViewZ inhouse post-processor
- Big data visualization for billions of points
- Parallel CPU and GPU visualization on multiple displays
- Customization of open source software like Paraview
- Visualization on Web/Cloud with 2D and 3D rendering
Specialized Applications
- Tensor visualization software
- 3D visualization for metal casting analysis
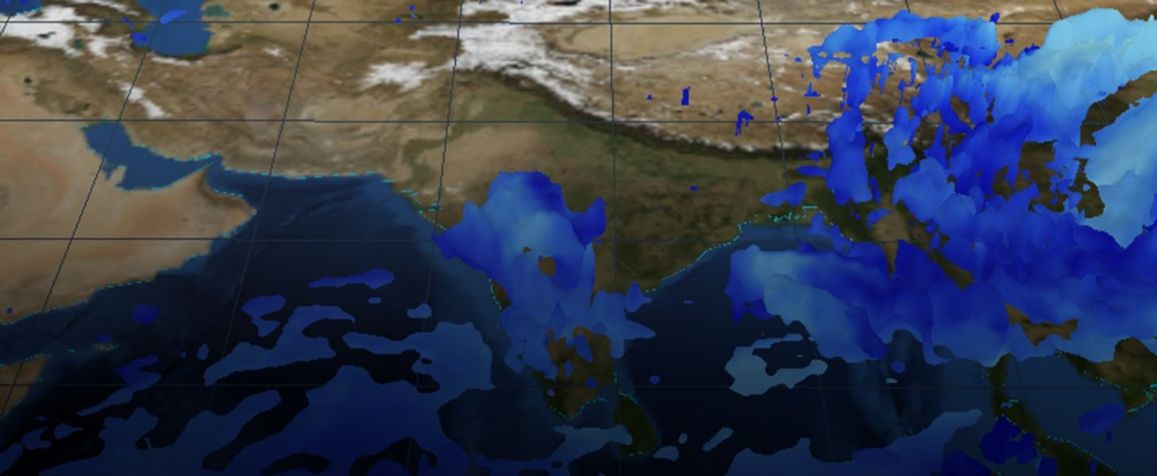
- Visualization of Ocean Related Meteorological Data
- Pollutant dispersion visualization in the city using GPU
- Software using on OpenGL, WebGL, Augmented Reality
Automated Post Processing
Surface Rendering
Volume Rendering
Particle Rendering
Flow Visualization
Multi-Body Dynamics
Computer graphic software makes use of a Visualization Tool Kit (VTK) to process, render and visualize scientific data. The VTK module is open-source software and can be integrated into any computer graphics software. VTK supports a large number of algorithms including scalar, vector, tensor, texture, and volumetric methods. The most common open-source software that makes use of the VTK module is ParaView. ParaView is a multi-platform visualization software used for wide scientific purposes. The software provides the capability for image processing and analyzing large scientific datasets.
To achieve fast rendering in 2D and 3D, the software module makes use of APIs which enable hardware acceleration. OpenGL and WebGL are two APIs that enable hardware acceleration. OpenGL allows acceleration only on software while WebGL allows acceleration on Web browsers. A surface field data can be visualized for scalar contours & iso-lines. A volume field can be visualized through a combination of sectional cuts and iso-surfaces. A 3D vector data like a flow field can be visualized with streamlines & path lines. Augmented Reality (AR) is revolutionizing the field of visualization by combining the real-world environment with computer-generated imagery.
Case Studies
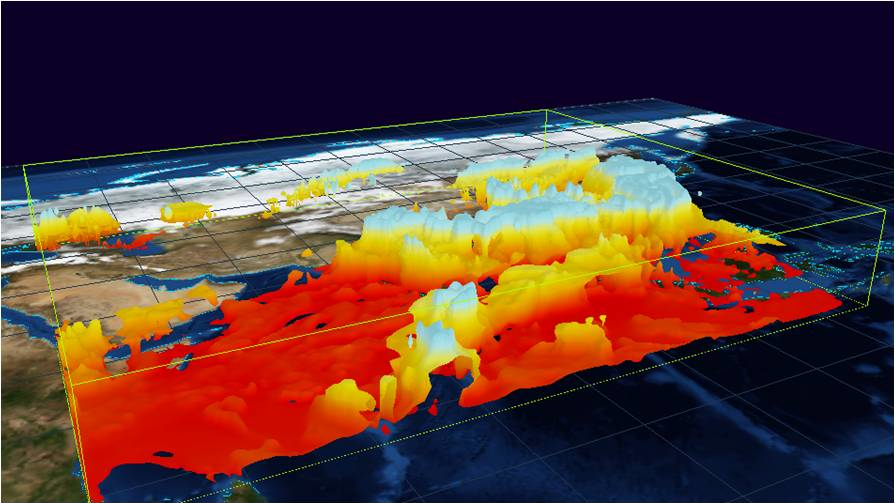
Software Development for Visualization of Ocean Related Meteorological Data
Numerical weather modelling and forecasting using high performance computing infrastructure...
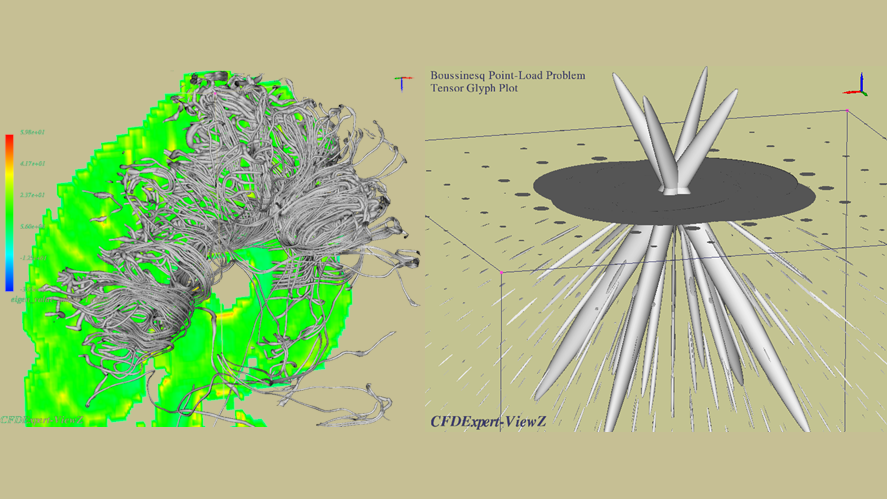
Development of Tensor Visualization Software
Tensors fields are generated in a broad range of areas like medical imaging, material sciences...
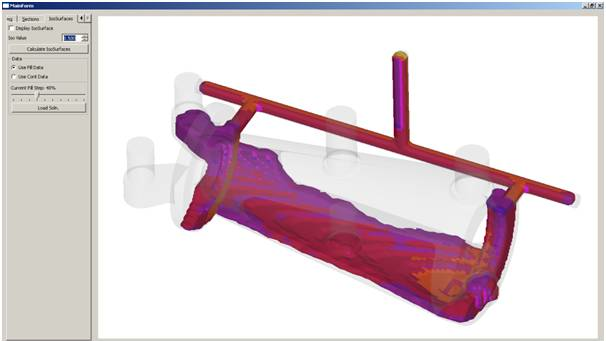
Development of a Custom 3-D Visualization Tool for Metal Casting Analysis
The visualization module was needed to be fast and accurate for enabling a high quality analysis...